

Benchmarks & Cloud Financial ROI
TriCache is engineered and benchmarked against high-concurrency microservice and edge workloads.
In-Memory Warm Read Throughput
Measured via native Node.js benchmarks (pnpm bench) with V8 garbage collection exposure on an 8-core machine:
| Cache Engine | Architecture | Throughput (ops/sec) | Latency (ns/op) | Allocation Overhead |
|---|---|---|---|---|
| TriCache (L1 RAM) | W-TinyLFU + Segmented LRU | 2,810,000 ops/s | 356 ns | 0 bytes (zero-alloc) |
lru-cache v11 | Doubly-linked list LRU | 2,150,000 ops/s | 465 ns | Minimal |
@neshca/cache-handler | In-Memory + Redis Adapter | 820,000 ops/s | 1,219 ns | Medium (wrapper overhead) |
keyv (in-memory) | Map wrapper | 1,400,000 ops/s | 714 ns | Low |
| Single-Tier Redis | Local VPC Network Hop | 8,500 ops/s | 1,200,000 ns (1.2 ms) | Network TCP socket |
Warm in-memory reads in TriCache run at 2.81 million ops/sec, bypassing V8 deserialization by referencing hot cached JS primitives.
Tier Latency Hierarchy
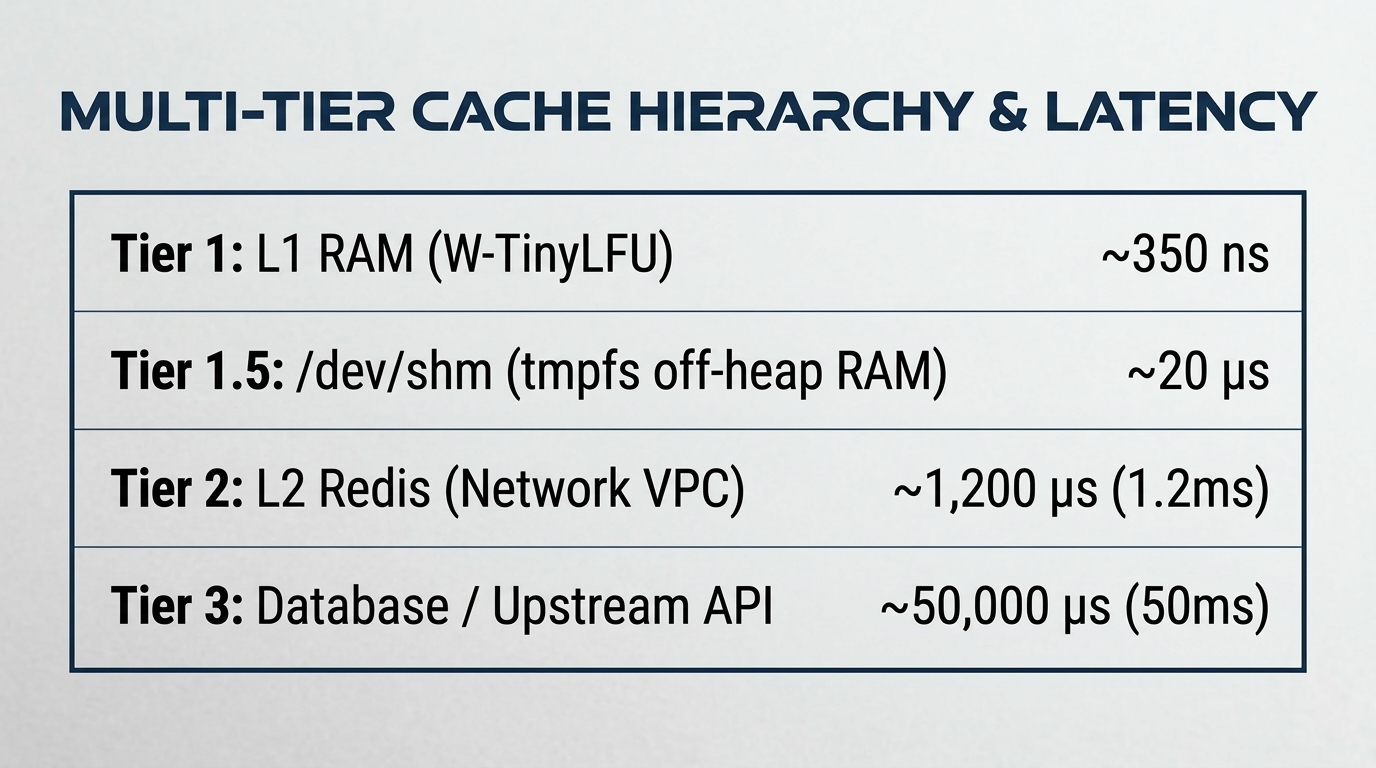
Latency Hierarchy Overview
┌─────────────────────────────────────────────────────────────┐
│  Tier 1: L1 RAM (W-TinyLFU)                ~350 ns          │
│  Tier 1.5: /dev/shm (tmpfs off-heap RAM)   ~20 µs           │
│  Tier 2: L2 Redis (Network VPC)            ~1,200 µs (1.2ms)│
│  Tier 3: Database / Upstream API           ~50,000 µs (50ms)│
└─────────────────────────────────────────────────────────────┘
Cloud ROI & Adversarial Simulation
To evaluate real-world infrastructure impact without theoretical bias, TriCache includes a deterministic cloud simulation based on an adversarial Zipfian workload (0xDEADBEEF).
Run the simulation locally:
pnpm bench:roi1. Operational Throughput & Tier Distribution
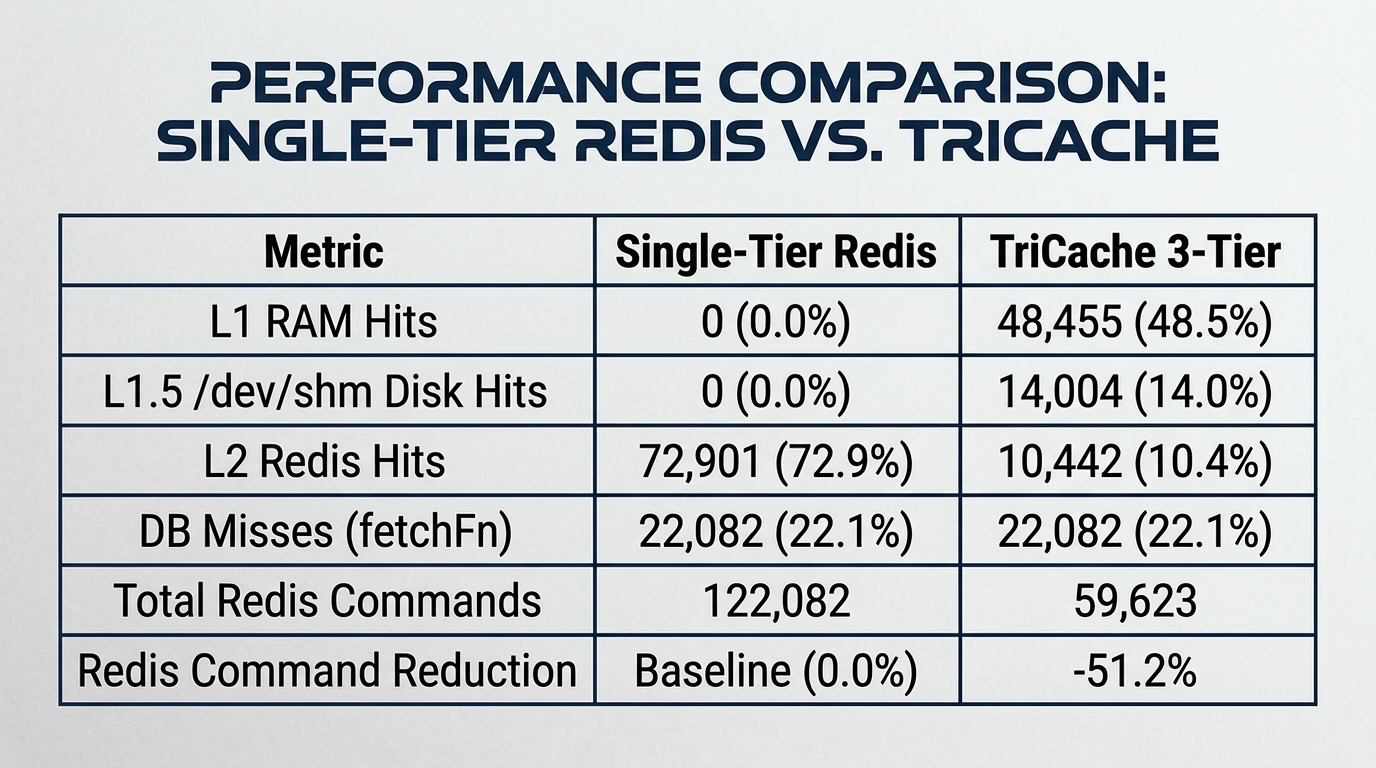
Throughput & Tier Distribution Data
+--------------------------+---------------------+---------------------+
| Metric                   | Single-Tier Redis   | TriCache 3-Tier     |
+--------------------------+---------------------+---------------------+
| L1 RAM Hits              | 0 (0.0%)            | 48,455 (48.5%)      |
| L1.5 /dev/shm Disk Hits  | 0 (0.0%)            | 14,004 (14.0%)      |
| L2 Redis Hits            | 72,901 (72.9%)      | 10,442 (10.4%)      |
| DB Misses (fetchFn)      | 22,082 (22.1%)      | 22,082 (22.1%)      |
| Total Redis Commands     | 122,082             | 59,623              |
| Redis Command Reduction  | Baseline (0.0%)     | -51.2%              |
+--------------------------+---------------------+---------------------+
2. Latency Percentile Compression
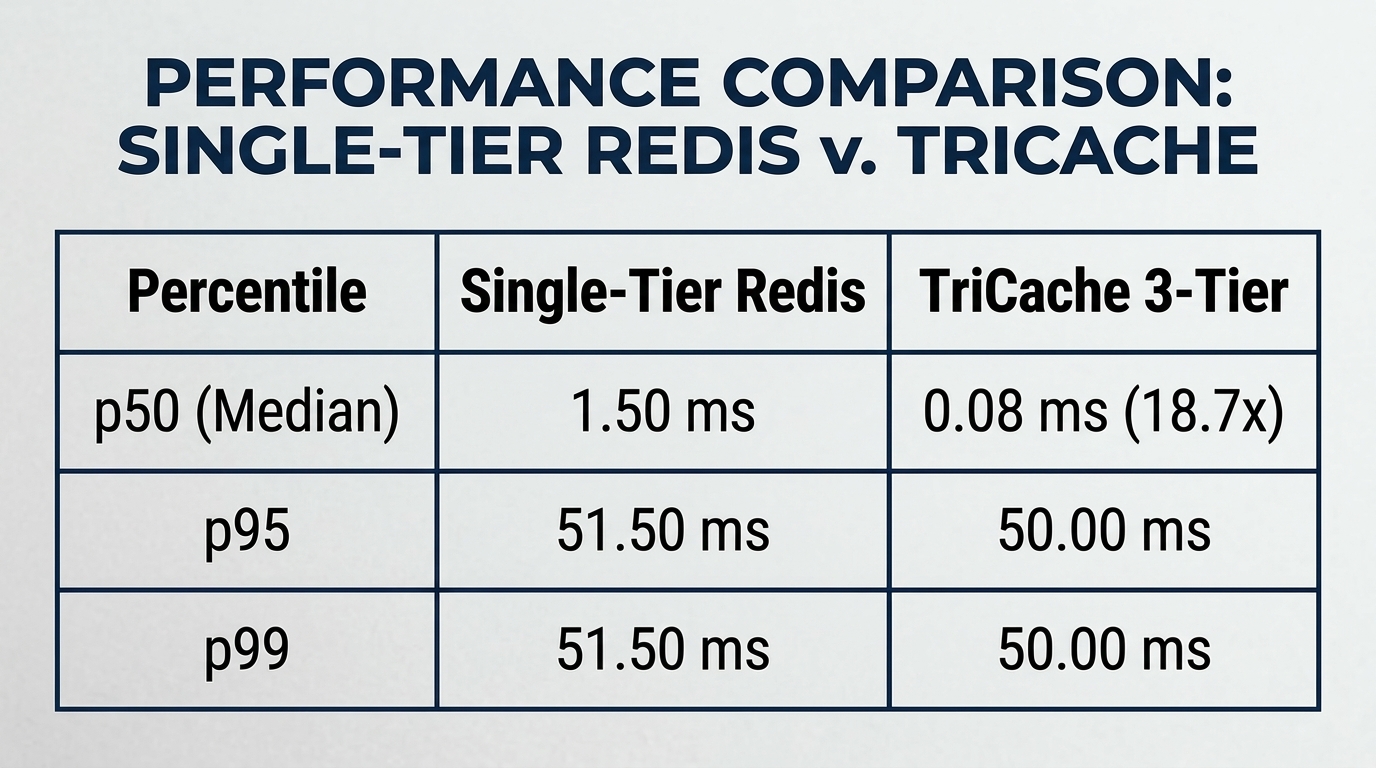
Percentile Compression Data
+--------------------------+---------------------+---------------------+
| Percentile               | Single-Tier Redis   | TriCache 3-Tier     |
+--------------------------+---------------------+---------------------+
| p50 (Median)             | 1.50 ms             | 0.08 ms (18.7x)     |
| p95                      | 51.50 ms            | 50.00 ms            |
| p99                      | 51.50 ms            | 50.00 ms            |
+--------------------------+---------------------+---------------------+
3. AWS Infrastructure Financial Savings (100M req/day fleet)
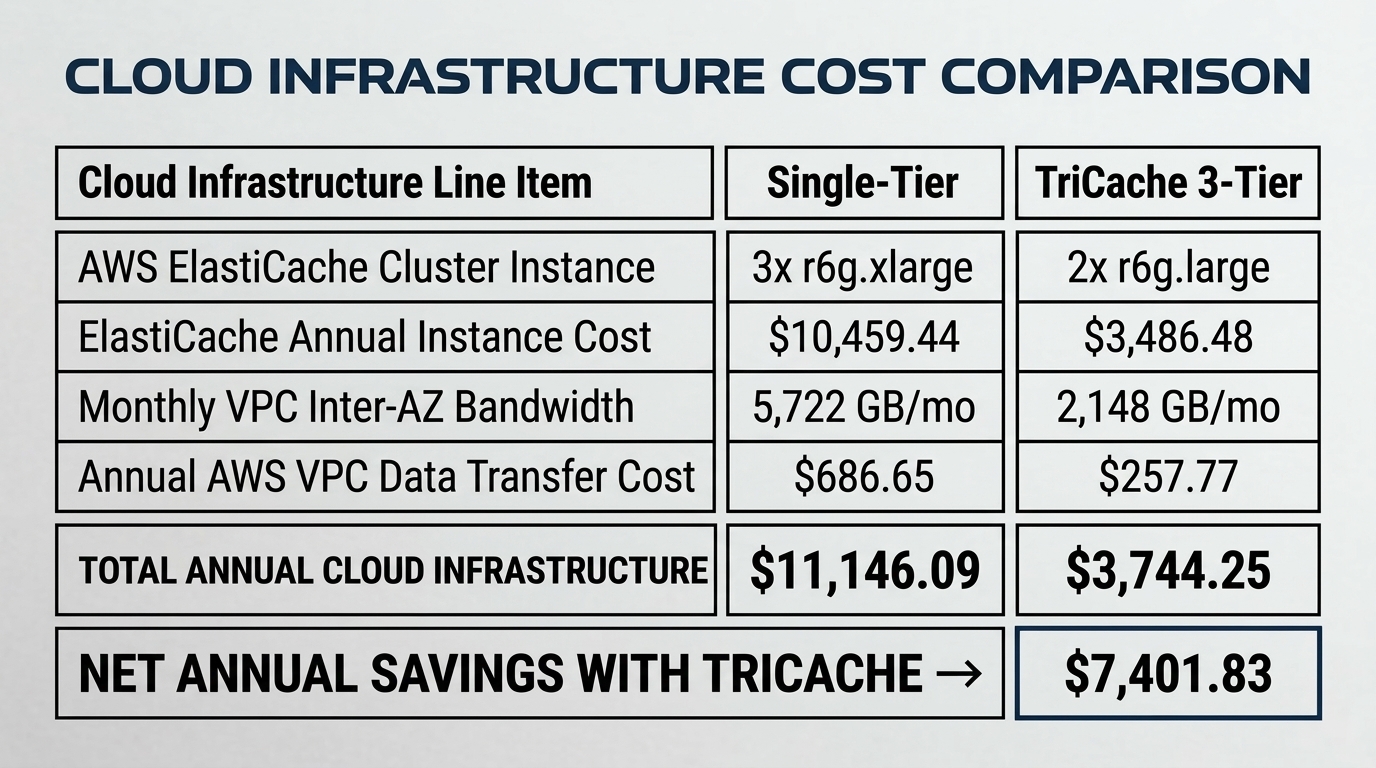
Financial Savings Breakdown
+-------------------------------------+------------------+------------------+
| Cloud Infrastructure Line Item      | Single-Tier      | TriCache 3-Tier  |
+-------------------------------------+------------------+------------------+
| AWS ElastiCache Cluster Instance    | 3x r6g.xlarge    | 2x r6g.large     |
| ElastiCache Annual Instance Cost    | $10,459.44       | $3,486.48        |
| Monthly VPC Inter-AZ Bandwidth      | 5,722 GB/mo      | 2,148 GB/mo      |
| Annual AWS VPC Data Transfer Cost   | $686.65          | $257.77          |
+-------------------------------------+------------------+------------------+
| TOTAL ANNUAL CLOUD INFRASTRUCTURE   | $11,146.09       | $3,744.25        |
+-------------------------------------+------------------+------------------+
| NET ANNUAL SAVINGS WITH TRICACHE    | ->               | $7,401.83        |
+-------------------------------------+------------------+------------------+
Executive Takeaway
TriCache absorbs 51.2% of Redis command volume directly in local RAM and /dev/shm, dropping median latency by 18.7× and saving $7,401.83/year per cluster while protecting upstream databases from stampedes.
Granular Micro-Benchmarks
Data collected via pnpm bench under Node.js
1. Bloom Filter Probe Cost
The WASM Bloom filter is
| Operation | Throughput | Latency | Notes |
|---|---|---|---|
| Definite miss (never set) | 5,360,000 ops/s | 187 ns | 7 hash rounds |
| Hit path (confirmed present) | 3,220,000 ops/s | 310 ns | 7 hash rounds |
2. Serialization Throughput (msgpackr 2.1.0)
| Payload Size | Throughput | Latency |
|---|---|---|
| 128 B | 827,700 ops/s | 1.21 µs |
| 256 B | 706,200 ops/s | 1.42 µs |
| 512 B | 625,800 ops/s | 1.60 µs |
| 1,024 B (1 KB) | 472,300 ops/s | 2.12 µs |
| 4,096 B (4 KB) | 228,600 ops/s | 4.37 µs |
3. Cryptographic Ciphers & Obfuscation (L2 Redis & Disk)
| Mode | Payload Size | Encrypt Latency | Decrypt Latency | Throughput |
|---|---|---|---|---|
| AES-256-GCM | 64 B | 7.12 µs | 6.43 µs | 155,500 ops/s |
| AES-256-GCM | 4 KB | 17.12 µs | 20.84 µs | 58,400 ops/s |
| AES-128-GCM | 64 B | 6.72 µs | 5.78 µs | 173,000 ops/s |
| AES-128-CTR | 64 B | 5.32 µs | 5.08 µs | 196,900 ops/s |
| XOR Obfuscation | 64 B (32-bit CPU path) | 0.41 µs (412 ns) | 0.47 µs (476 ns) | 2,430,000 ops/s |
4. L1 Memory Iteration (500 live entries)
| Method | Throughput | Latency | Notes |
|---|---|---|---|
cache.keys() | 26,600 ops/s | 37.53 µs | No [key, entry] tuple allocation |
cache.values() | 35,500 ops/s | 28.19 µs | Direct yield* delegation |
cache.entries() | 24,000 ops/s | 41.73 µs | Stripped namespace keys |
cache.scan(fn) | 210,000 ops/s | 4.76 µs | Zero-alloc direct index scan |