

Visual Dashboard & Terminal CLI
Package entry:
tricache/dashboardand CLI binarynpx tricache
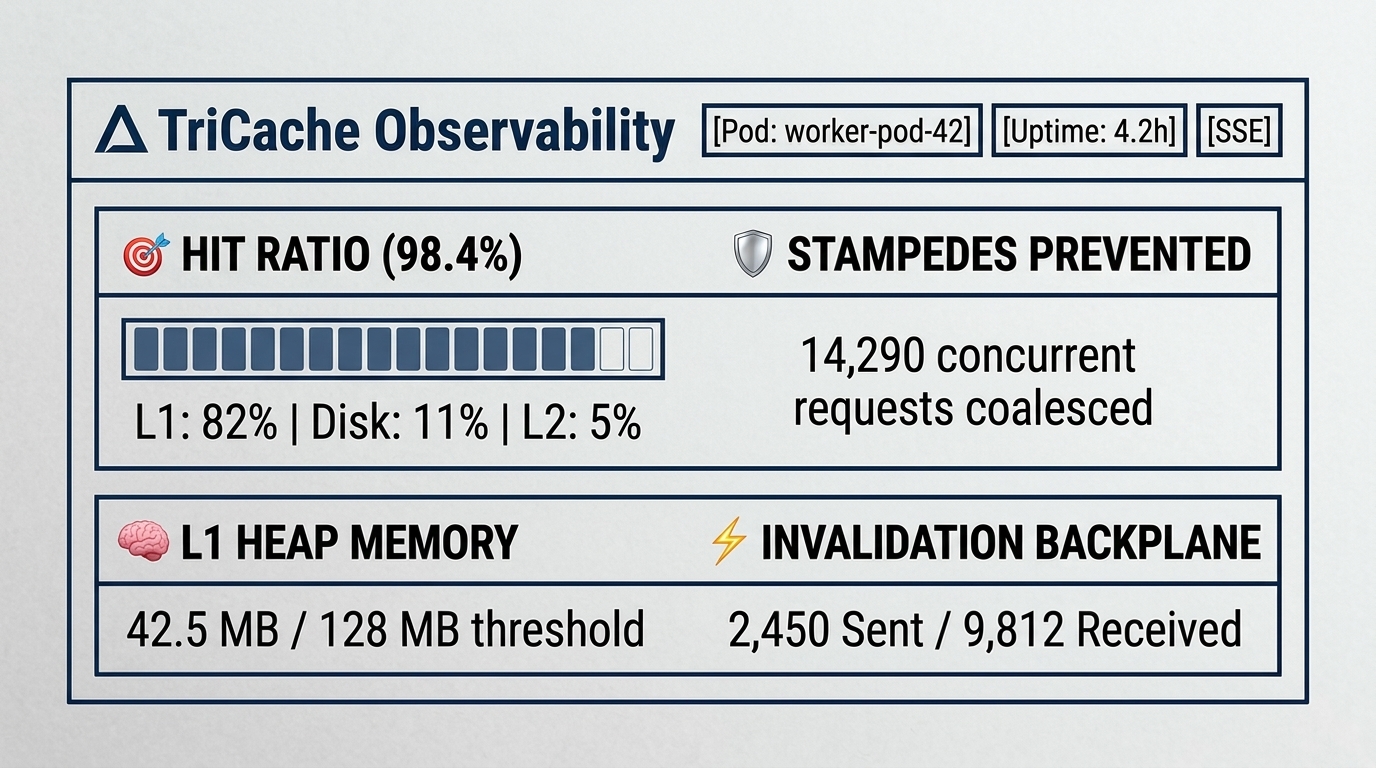
TriCache includes an enterprise visual administration suite with zero external CDN dependencies (100% air-gappable), plus a command-line interface for terminal workflows.
1. Embedded Single-Page Web UI
Mount the real-time Server-Sent Events (SSE) administration dashboard into any Node.js web server:
typescript
import { tricacheDashboard } from 'tricache/dashboard';
import { cache } from './cache';

// Express / Fastify / Connect
app.use(
  '/admin/cache',
  tricacheDashboard({
    cache,
    basePath: '/admin/cache',
    title: 'Fleet Cache Console',
    auth: {
      username: 'admin',
      password: process.env.DASHBOARD_PASSWORD ?? 'secret',
    },
    readOnly: process.env.NODE_ENV === 'production',
  })
);
2. Next.js 16 & 15 App Router
Mount the dashboard inside a Next.js App Router project:
typescript
// app/admin/cache/[...slug]/route.ts
import { createNextDashboardHandlers } from 'tricache/dashboard';
import { cache } from '@/lib/cache';

export const { GET, POST } = createNextDashboardHandlers({
  cache,
  basePath: '/admin/cache',
  authSecret: process.env.MANAGEMENT_SECRET,
  readOnly: process.env.NODE_ENV === 'production',
});
3. Standalone Management Server (Kubectl Port-Forwarding)
For backend microservices and container pods that do not expose public HTTP endpoints:
typescript
import { startDashboardServer } from 'tricache/dashboard';
import { cache } from './cache';

const server = await startDashboardServer({
  cache,
  port: 9090,
  host: '127.0.0.1',
  authSecret: process.env.MANAGEMENT_SECRET,
});

console.log(`Cache management server listening on port ${server.port}`);
Access securely via Kubernetes without opening public ingress routes:
bash
kubectl port-forward pod/api-service-pod 9090:9090
# Open in browser: http://localhost:9090?token=<MANAGEMENT_SECRET>
4. Terminal CLI (npx tricache)
Manage and inspect active instances directly from your terminal:
bash
# Display live ASCII dashboard
npx tricache inspect --redis redis://127.0.0.1:6379

# Invalidate tags across all cluster nodes
npx tricache invalidate --tag products --redis redis://127.0.0.1:6379

# Measure 3-tier round-trip latency
npx tricache ping --redis redis://127.0.0.1:6379

# Export metrics
npx tricache metrics --prometheus