

Observability & Telemetry
Enterprise Monitoring Reference: Embedded Real-Time SSE Dashboard, Grafana Dashboard, Prometheus Alerts, Terminal CLI, and OpenTelemetry Distributed Tracing.
1. Visual Single-Page Web Dashboard (tricache/dashboard)
TriCache includes an enterprise-ready visual administration suite with zero external CDN dependencies (100% self-contained and air-gappable).
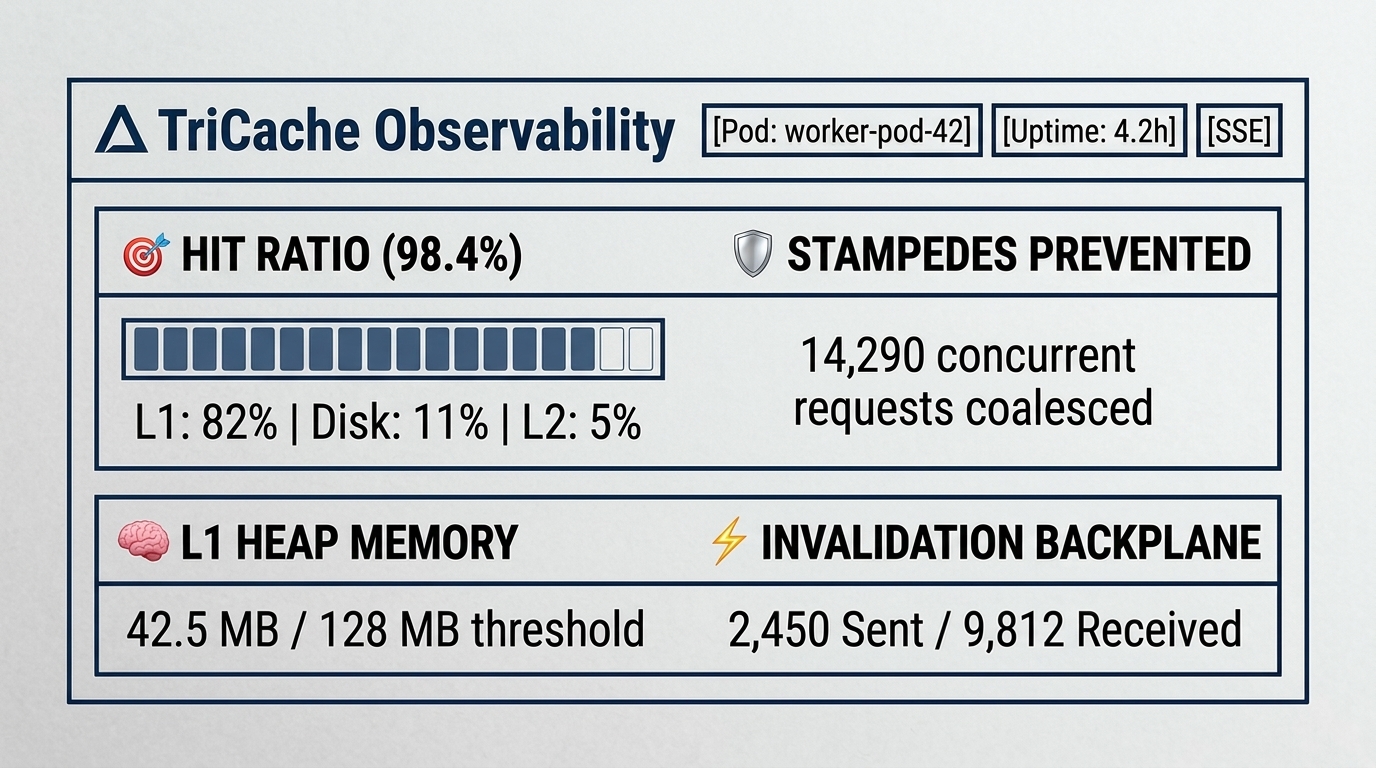
Terminal ASCII Representation
┌─────────────────────────────────────────────────────────────────────────────┐
│  Δ TriCache Observability       [Pod: worker-pod-42] [Uptime: 4.2h] [SSE]  │
├─────────────────────────────────────────────────────────────────────────────┤
│  🎯 HIT RATIO (98.4%)           🛡️ STAMPEDES PREVENTED                      │
│  [====================  ]       14,290 concurrent requests coalesced        │
│  L1: 82% | Disk: 11% | L2: 5%                                              │
├─────────────────────────────────────────────────────────────────────────────┤
│  🧠 L1 HEAP MEMORY              ⚡ INVALIDATION BACKPLANE                  │
│  42.5 MB / 128 MB threshold     2,450 Sent / 9,812 Received                 │
└─────────────────────────────────────────────────────────────────────────────┘
Express, Fastify & Node.js Middleware
Mount the dashboard inside your existing service with timing-safe authentication and audit logging:
import { tricacheDashboard } from 'tricache/dashboard';
import { cache } from './cache';

// Express / Fastify / Connect
app.use(
  '/admin/cache',
  tricacheDashboard({
    cache,
    basePath: '/admin/cache',
    title: 'Production Cache Fleet',
    // 🔒 Timing-Safe Authentication (SHA-256 constant-time comparison)
    auth: {
      username: 'admin',
      password: process.env.DASHBOARD_PASSWORD ?? 'super-secret',
    },
    // 🛡️ Read-Only Mode (disables manual Clear/Invalidate buttons in production)
    readOnly: process.env.NODE_ENV === 'production',
    // 🏷️ Audit logging hook for enterprise compliance
    onAction: (event) => {
      console.log(`[AUDIT] Action: ${event.action}, Target: ${event.target}, User: ${event.user}`);
    },
  })
);
Next.js 16 & 15 App Router
Mount under the Next.js App Router via dynamic route handlers:
// app/admin/cache/[...slug]/route.ts
import { createNextDashboardHandlers } from 'tricache/dashboard';
import { cache } from '@/lib/cache';

export const { GET, POST } = createNextDashboardHandlers({
  cache,
  basePath: '/admin/cache',
  authSecret: process.env.MANAGEMENT_SECRET,
  readOnly: process.env.NODE_ENV === 'production',
});
Standalone Management Server (Kubectl Port-Forwarding)
For background workers or isolated microservices without a public HTTP listener:
import { startDashboardServer } from 'tricache/dashboard';
import { cache } from './cache';

const server = await startDashboardServer({
  cache,
  port: 9090,
  host: '127.0.0.1', // Bound strictly to localhost
  authSecret: process.env.MANAGEMENT_SECRET,
});

console.log(`Management server listening on port ${server.port}`);
Access securely via Kubernetes without exposing ingress routes:
kubectl port-forward pod/my-service-pod 9090:9090
# Open browser: http://localhost:9090?token=<MANAGEMENT_SECRET>
2. Pre-Built Grafana Dashboard & Prometheus Alerts
TriCache ships pre-configured production monitoring assets in the repository:
Grafana Dashboard JSON (dashboards/tricache-grafana.json)
Import directly into Grafana for instant fleet-wide visibility:
- Templated Multi-Tenant Variables:
$datasource,$namespace,$service, and$pod. - Visual Panels:
- Real-Time Hit Ratio Breakdown (L1 RAM vs. L1.5 Disk vs. L2 Redis vs. DB Misses)
- Stampedes Prevented & Singleflight Coalesced Requests
- SWR Async Refresh Rates & Background Worker Latency
- L1 Heap Usage, OOM Watermark Breaches & Emergency Purges
- Cross-Region Invalidation Mesh Health & Deduplication Ratios
- Disk Tier Backpressure Queue Depth & Host Low Space Pauses
💡 Looking to expose a
/metricsscrape endpoint? See the Prometheus /metrics Scraping Recipe for Express, Fastify, and Next.js App Router endpoint recipes, scrape configs, and a one-command local Docker dev stack.
Prometheus Alert Rules (dashboards/tricache-alerts.yaml)
Turnkey PrometheusRule manifests ready for Prometheus Operator / VictoriaMetrics:
groups:
  - name: tricache.alerts
    rules:
      - alert: TriCacheOOMWatermarkBreached
        expr: tricache_oom_evictions_total > 0
        for: 2m
        labels:
          severity: warning
        annotations:
          summary: "TriCache emergency L1 evictions triggered by heap pressure"

      - alert: TriCacheCircuitBreakerOpen
        expr: tricache_disk_latency_bypass_stage == 3
        for: 1m
        labels:
          severity: critical
        annotations:
          summary: "TriCache disk latency watchdog tripped into full bypass mode"

      - alert: TriCacheHitRatioDegraded
        expr: tricache_l1_hit_rate < 0.60
        for: 5m
        labels:
          severity: warning
        annotations:
          summary: "TriCache hit ratio dropped below 60% over 5 minutes"
3. OpenTelemetry Distributed Tracing & Metrics
TriCache includes structural compatibility with @opentelemetry/api without adding heavy runtime dependencies:
import { trace, metrics } from '@opentelemetry/api';
import { CacheService } from 'tricache';

const cache = CacheService.create({
  // 1. Native Distributed Tracing
  tracer: trace.getTracer('my-service'),

  // 2. Native OTel Metrics Exporter
  meter: metrics.getMeter('my-service'),
});
Standardized Semantic Conventions:
- Spans Emitted:
tricache.get,tricache.set,tricache.delete,tricache.clear,tricache.mget,tricache.mset,tricache.mdel,tricache.invalidate_tag. - Span Attributes:
cache.hit:true|falsecache.namespace: current namespace prefixcache.key_prefix: first segment of the key (e.g.'user')cache.ttl: TTL in secondscache.l1_hits,cache.l2_hits: tier hits during batch operations
- W3C Distributed TraceContext Propagation: Use
parseTraceParent()andformatTraceParent()to propagate trace IDs across cross-region invalidation events.
4. Live Terminal CLI & Top Monitor (tricache top)
TriCache provides a terminal administration and live ASCII top monitor powered by a platform-agnostic IPC bridge:
Live Process Monitor (tricache top)
Inspect any live TriCache host process in real time without HTTP overhead or network latency:
# Auto-detect and monitor local TriCache process
npx tricache top

# Target specific process by PID or custom socket / pipe
npx tricache top --pid 12345
npx tricache top --socket /tmp/tricache-12345.sock

# Single snapshot output for CI, cron, or piping
npx tricache top --once

# Machine-readable JSON telemetry
npx tricache top --once --json
╔══════════════════════════════════════════════════════════════════════════════════════╗
║ TriCache Monitor [PID: 4321 ] Uptime: 2h 15m Namespace: prod-api ║
╠══════════════════════════════════════════════════════════════════════════════════════╣
║ Hit Ratios & Tier Breakdown (Total Gets: 1,452,100 ) ║
║ L1 (RAM): [████████████░░░░░░] 65.4% ( 950,200 hits) ║
║ L1.5(Disk): [████░░░░░░░░░░░░░░] 20.1% ( 291,872 hits) ║
║ L2 (Redis): [██░░░░░░░░░░░░░░░░] 10.2% ( 148,114 hits) ║
║ Misses: [█░░░░░░░░░░░░░░░░░] 4.3% ( 61,914 fetches) ║
║ Stampedes Saved: 42,100 coalesced concurrent requests ║
╠══════════════════════════════════════════════════════════════════════════════════════╣
║ Memory & Storage Headroom ║
║ L1 Memory: [███████░░░░░░░░░░░] 42.5 MB / 128 MB ( 14,250 entries) ║
║ Disk Spill: 112 MB / 500 MB ( 1,240 files) ║
╠══════════════════════════════════════════════════════════════════════════════════════╣
║ Protection & Health Diagnostics ║
║ Watchdog: Stage 0 (Normal) L2 Circuit Breaker: closed ║
║ Disk p95: 1.25ms Redis p95: 0.85ms Bypassed: 0 ║
║ OOM Evictions: 0 SWR Revalidations: 12,410 ║
╠══════════════════════════════════════════════════════════════════════════════════════╣
║ 🔥 Top Hot Keys (Count-Min Sketch) ║
║ 1. user:profile:102 14,200 hits (2.1 KB) ║
║ 2. config:tenant:global 9,840 hits (8.4 KB) ║
║ 3. catalog:category:electronics 5,420 hits (16.2 KB) ║
╚══════════════════════════════════════════════════════════════════════════════════════╝Enabling IPC Telemetry in Your App
To enable the local IPC bridge in your application, set enableIpc: true:
import { CacheService } from 'tricache';

const cache = CacheService.create({
  namespace: 'my-app',
  enableIpc: true, // Listens on /tmp/tricache-<pid>.sock or \\.\pipe\tricache-<pid>
});- Platform-Agnostic IPC: Automatically resolves to Unix domain sockets on POSIX (
/tmp/tricache-<pid>.sockor$TMPDIR/...) and Windows Named Pipes (\\.\pipe\tricache-<pid>) onwin32. - Non-Blocking Telemetry Pull: Serialization and stats sampling run on tick boundaries via
setImmediate, eliminating event-loop stalls in the monitored host application. - POSIX Socket Hygiene: Automatically registers
process.once('exit'),SIGINT, andSIGTERMsignal traps to clean up socket files on termination.
5. Standalone Troubleshooting Commands
# 1. Live cluster telemetry inspection
npx tricache inspect --redis redis://127.0.0.1:6379

# 2. Clear keys matching a prefix
npx tricache clear --prefix user: --redis redis://127.0.0.1:6379

# 3. Measure three-tier round-trip latency
npx tricache ping --redis redis://127.0.0.1:6379